Review RFCode trends
Use the Code Trend Summary report to review any cross-section of RFCodes. The report displays past, current, and forecast data for any combination of individual or summarized RFCodes and RFGroups, and enables you to review code trends.
Totals for the groups and codes are displayed in the report’s Summary section with links to a Details section that provides a breakdown of totals. The report also displays percentage change data that shows how much change has occurred (or is likely to occur) between months and quarters, which helps you identify potential problem areas.
This report is part of a series of executive summary reports that help you review, finalize, and improve the integrity of your forecasts.
Run the Code Trend Summary
NOTE: To work with this report, verify that Rolling Forecasting actual data is loaded and forecast data exists for the periods used in the report.
-
In the task pane under Reporting, double-click Trend Summary.
-
On the Refresh Variables dialog, select the RFGroups and RFCodes to review and how you want the data to be displayed, and then click OK. The following table provides descriptions of the options:
Field Description Select RFGroup Field to Filter By Select the group type for the source data. Select [GROUP NAME] (Leave blank for All) To pull data from all groups, leave the default (All), or select one or more specific groups. Select RFCode Field to Filter by Select this option to view trend data by available listed RFCodes.
NOTE: RFCodes that are available for selection are set by the RF Admin or Analyst in the Report Options tab of the Planning Configuration utility.
Select [FIELD NAME] (Leave blank for All) To pull data from all fields, leave the default (All), or select one or more specific fields. For example, you can select a specific section of RFCodes. Select Period View Select this option to compare data by month (the default) or by quarter. Select # of Actual [PERIOD or QUARTER] Select the number of periods of past data (actuals) to include in the report. You can include up to two years of actual data. Select # of Forecast [PERIOD or QUARTER] Select the number of periods of future data (forecast) to include in the report. You can include up to three years of forecast data. Include in CY Budget? Select this check box to include data from the current year's budget. Select Scenario Select the scenario to apply to the report data. Include Approved Initiatives? Select this option to include data from approved initiatives.
NOTE: To include historical initiative data, verify that historical initiatives included in this report are set to Approve for the historical periods in this report. For information, see Update initiative status.
Group Data Into Sections with SubTotals? Displays the data grouped by RFCode.Type. When you select this option, the Summary section provides links to the Detail sections. If you do not select this option, all data is displayed in a list by group type without links in the Summary section. Select RFGroup Summation Level Select the RFGroup level at which to sum the report data. This group is displayed in the first column of the report. The tables on the right display totals for each item or person listed in the group. Select RFCode Summation Level Select the group level at which to sum the reported RFCode data. This group is displayed in the second column of the report. NOTE: When viewing the report, you can change the criteria to view different sets of data or data grouped in different ways. On the Main ribbon tab, click Refresh Data, and then change the selections.
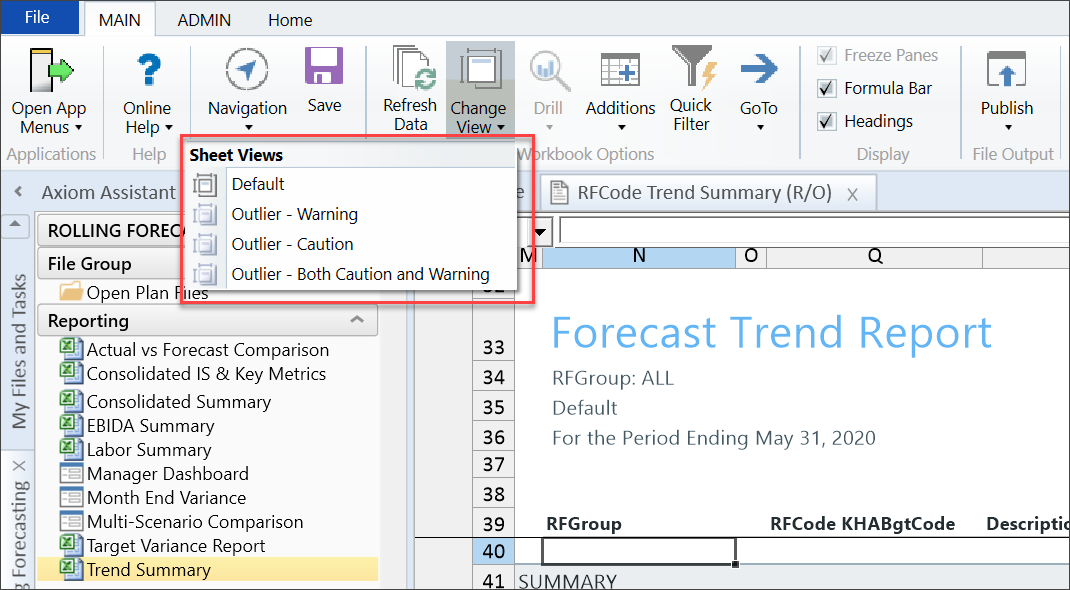
Outlier views
Use the options on the Change Views menu to highlight outlier trends. These options help you determine if you need to update data in the plan files prior to finalizing the forecast period.
Outlier views are available for:
-
Warning - Flagged in red in the report
-
Caution - Flagged in yellow in the report
-
Both Caution and Warning - Caution areas are flagged in yellow; Warning areas are flagged in red
The outlier views recognize when established rules were broken at the following hierarchy levels, each of which corresponds with the RFCode Summation Level refresh variable:
-
RFCode Type
-
FSSummary
-
FSDetail
NOTE: The conditional formats are dependent upon the Caution and Warning rules built in the Planning Configuration Driver under the Report Options tab.
Example
In the following example, the selected data type is RFGroup, with the RFGroups summation level set to RFGroup, and the RFCode Summation level set to FSSummary. Three months of actual and forecast data is displayed. Summarized data is displayed in the top section with links to detailed data in the lower section.
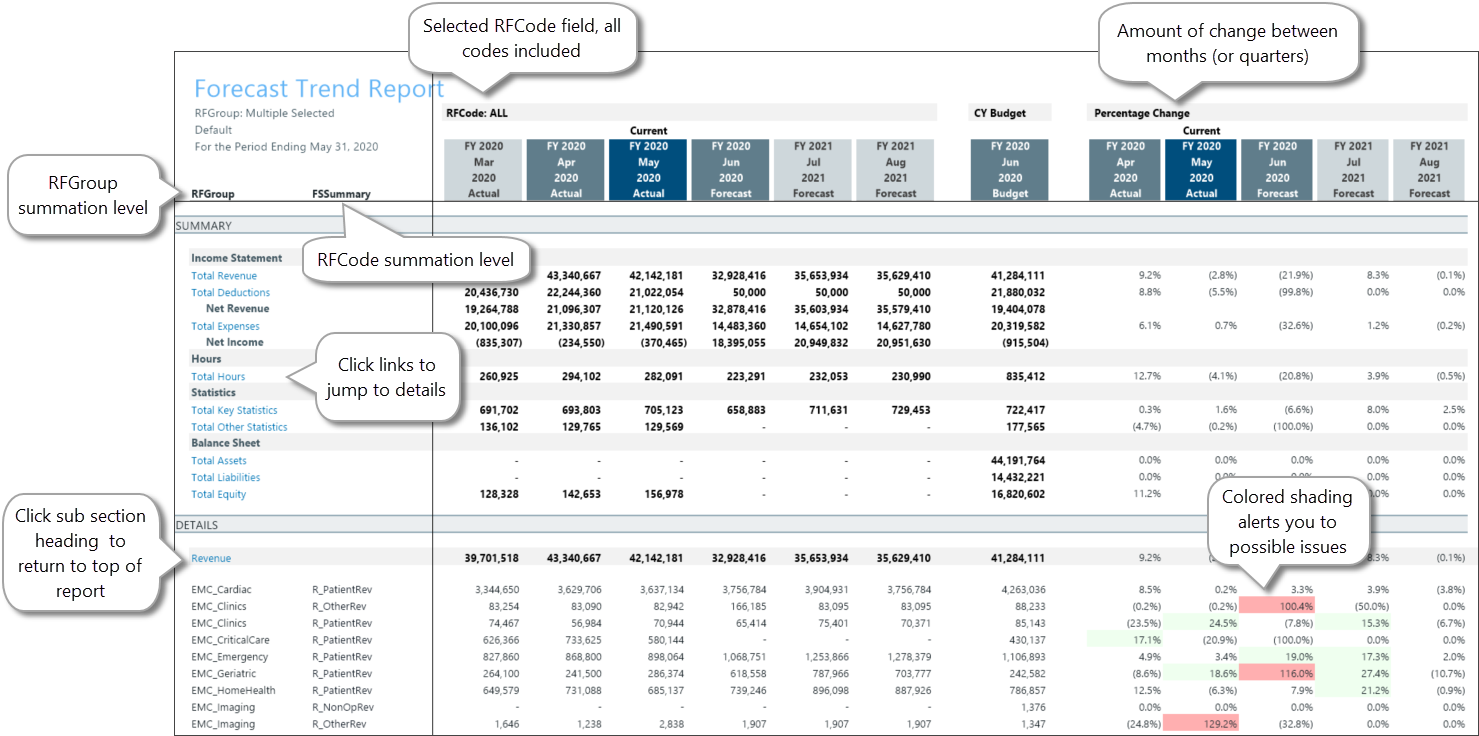
-
